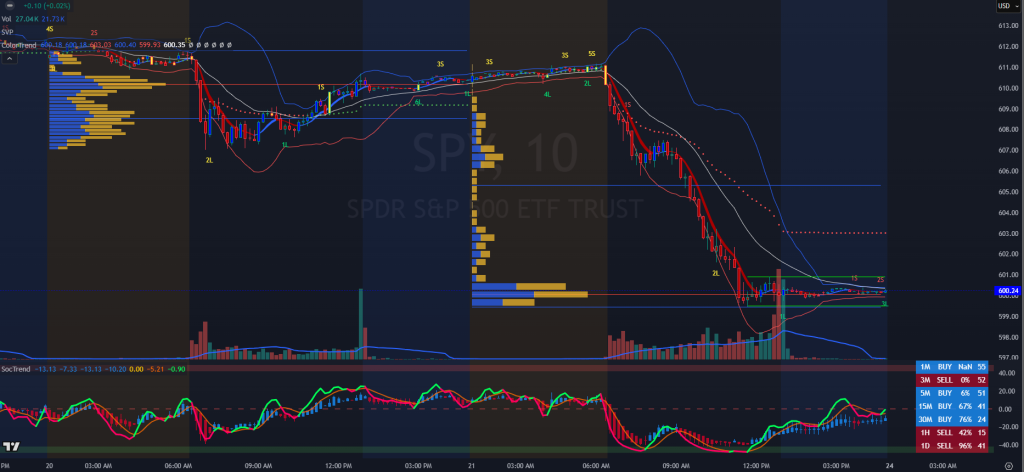
What distinguishes SocTrend as a powerful tool for supporting traders?
SocTrend employs the powerful algorithms of Heikin Ashi candlesticks, RSI, and Volume to comprehensively analyze various time frames. This enables traders to grasp market trends and buying/selling strength across different durations. The benefits of Heikin Ashi, RSI, and Volume are outlined below.

Discover Heikin Ashi, a powerful trading technique renowned for its benefits:
- Smoother Price Representation: Heikin Ashi’s formula smooths prices, reducing noise from traditional charts. Clearer trends and potential reversals emerge.
- Spot Trends Effectively: Heikin Ashi excels in trend spotting. Smoothed bars offer distinct direction (up, down, sideways), aiding informed choices.
- Visualize Trend Strength: Color-coded bars (green for uptrends, red for downtrends) visualize trend intensity. Uniform colors indicate strong moves.
- Enhance Accuracy: Smoothing minimizes false signals seen in standard charts, refining entry and exit precision.
- Early Reversal Recognition: Heikin Ashi spots reversals early. Smooth bars swiftly highlight trend shifts, allowing quick responses.
- Pinpoint Levels with Precision: Reduced noise aids in identifying support and resistance levels, enhancing key price point assessment.
- Optimize Risk Management: Smoother display aids risk management by offering clearer trend views. Adjusting position sizes and stop-loss levels becomes more effective.
- Versatile Analysis: Heikin Ashi suits various time frames, enabling trend recognition across scales for well-informed trading decisions.
Remember, Heikin Ashi might not align with every strategy or trading style. Before using Heikin Ashi charts, consider your goals, preferences, and traded assets. Soctrend’s purpose is to support market trend and ColorTrend
The Relative Strength Index (RSI) is a pivotal trading indicator with numerous benefits. These include:
- Overbought and Oversold Conditions: RSI detects overbought (red zone) and oversold (Blue Zone) levels, hinting at potential price reversals.
- Momentum Insights: RSI gauges trend strength by analyzing the rate of price changes, aiding entry and exit choices.
- Divergence Identification: RSI spots divergences between price and RSI, signaling potential reversals.
- Trend Confirmation: RSI confirms trend strength, crucial for trend-following strategies.
- Support and Resistance Clues: RSI uncovers support and resistance levels, enhancing breakout identification.
- Early Reversal Signals: RSI can provide early hints of trend shifts.
- Versatility Across Time Frames: RSI adapts to various time frames, accommodating diverse trading strategies.
- Synergy with Other Indicators: RSI complements other indicators, enhancing signal validation.
In SocTrend, trader can see value of RSI, market trends and volume at multi-timeframe. It is highly effective for gaining a clear view of the market’s current state.
By providing insights into conditions, momentum, and trends, RSI refines trading strategies. Nonetheless, as with any indicator, it’s wise to consider RSI alongside other factors and not solely rely on its signals.
You are welcome to join our Discord community to gain valuable insights into their exceptional achievements and capabilities.

This has been a pretty good indicator I have tried it out for the past week. I trade using price action and ICT techniques. I have minimal indicators on the chart, However this one showed up I guess as part of a promotion. I felt that somebody had done the work so I might as well try it out and give my opinion. I tried the indicator at a variety of time. And consistently found it helpful as a confirmatory device for my method of trading.
I typically do day trades and have found that I would rather trade at a 5 minute interval and do fewer traits during the day based on quality setups. Once again this pairs nicely with that approach. Your paragraph enjoy your day.
True. This indicator is solid and one of my favorite.
Thanks for fantastic information I was looking for this info for my mission.