The Rhythm indicator is designed to give us a detailed internal look at market conditions by analyzing key metrics. It leverages market breadth indicators, such as the TICK, VOLD, and ADD of NYSE and NASDAQ to provide a comprehensive internal market view. This allows traders to identify more accurate entry and hold points, using shorter timeframes efficiently for SPY, SPX, and ES.
Key Components of Rhythm’s Internal Market Analysis
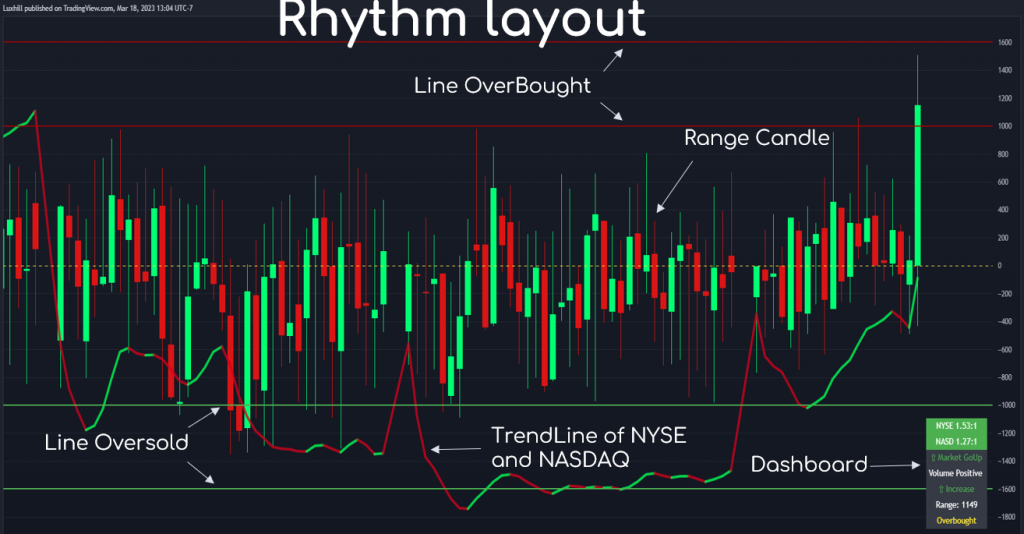
1. Tick – Range
The Tick measures the number of stocks ticking up minus the number ticking down across a specific market, often on NYSE and NASDAQ . It helps traders understand overall buying or selling pressure within the market.
Strengths and Usage:
Understanding Market Sentiment: Positive Tick values indicate more stocks are moving up, signaling buying interest; negative Tick values show a selling trend. Using this in conjunction with SPY, SPX, or ES allows traders to enter trades aligned with broader market sentiment.
Quick Decision-Making: On shorter timeframes (1-, 3-, 5-, and 10-minute charts), the Tick component offers rapid insights into market sentiment shifts, helping traders capture quick movements in the SPY, SPX, and ES markets.
Entry and Hold Decisions: With accurate Tick readings, traders can time entry points when the market shows buying strength, while negative values help you prepare for exits.
If the range rises and touches the red line, it indicates an overbought condition—watch for profit opportunities if you have a scalping order.
If the range falls and touches the blue line, it indicates an oversold condition—watch for profit opportunities if you have a scalping order.
For Tick
How to Read Volume.
The volume in Rhythm is calculated from the NYSE and NASDAQ, making the determination of market trends highly accurate.
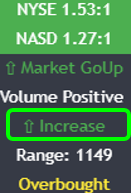
When the Dashboard Shows “Volume Positive”: Buying pressure is dominant, indicated by a green day at market open.
If Volume shows “Increase”: Buying power is still growing.
If Volume shows “Decrease”: Selling pressure is starting to enter.
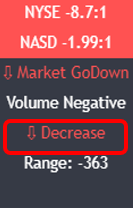
When the Dashboard Shows “Volume Negative”: Selling pressure is dominant, indicated by a red day at market open.
If Volume shows “Increase”: Selling power is increasing.
If Volume shows “Decrease”: Buying pressure is entering.
2. Market Trend of NYSE and NASDAQ
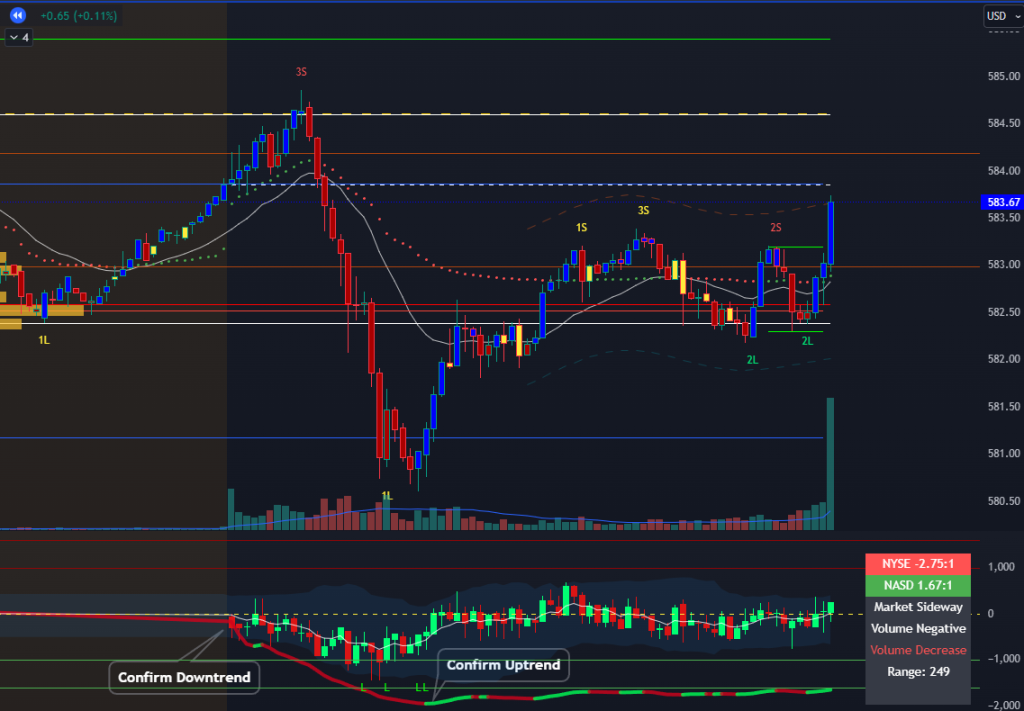
The line compares advancing stocks to declining stocks, making it instrumental in assessing whether a broad market uptrend or downtrend is supported by overall stock movement. Our algorithm based on the trend of two exchanges.
The market trend is determined by the Rhythm trendline.
If the trendline is green, it signals that internal market support aligns with an external market uptrend, indicating that SPY and SPX prices will rise.
If the trendline is red, it signals that internal market support aligns with an external market downtrend, indicating that SPY and SPX prices will fall.
If the internal market contradicts the external market, the market will move sideways.
Note: For optimal accuracy, entry points should be checked on 1-, 3-, 5-, and 10-minute time frames, ensuring both markets align.
Conclusion
The algorithms combine NYSE and NASDAQ volume data to provide traders with a more comprehensive market perspective. By integrating Tick and Add with the Rhythm indicator, traders gain a detailed internal market view, improving timing for trades in SPY, SPX, and ES. When used alongside price action and EMAs, this approach adds precision, supporting automated, accurate entry and hold points that align with market sentiment.