The best strategy involves utilizing just one indicator.
In the dynamic landscape of financial trading, the ability to discern pivotal data points can mean the difference between capitalizing on a lucrative opportunity and lamenting a missed one. Enhance your strategic approach with the ‘SocLevel‘ indicator—an advanced tool meticulously designed for traders aiming to gain a competitive advantage in their analyses.
This indicator leverages algorithms encompassing Price Action, Divergence, Market Structure, and 9 key levels, tailored precisely for monitoring stocks with a focus on intraday. The majority of successful traders prioritize monitoring significant key levels due to the robust price reactions observed near these levels.
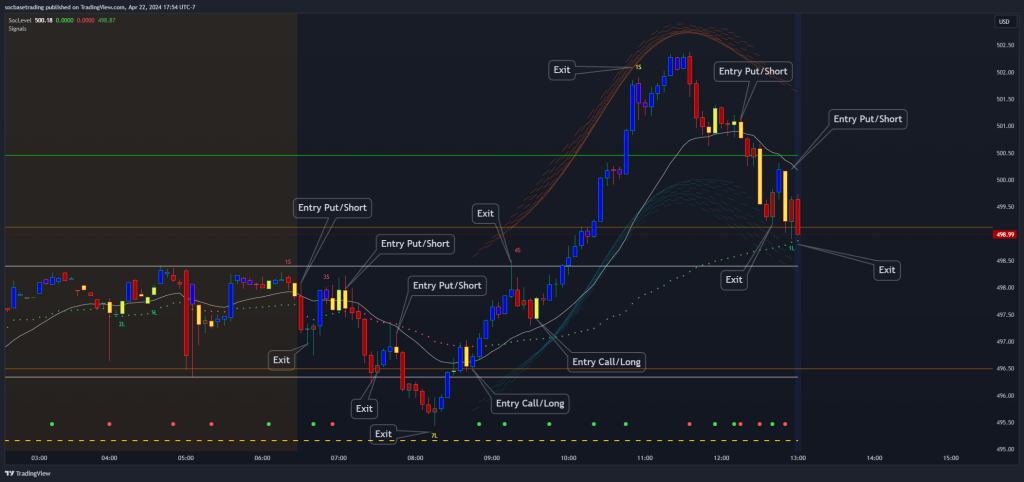
A Comprehensive Glimpse into Daily Levels:
- Beyond being a mere daily level plotter, this tool emerges as an avant-garde system encapsulating:
- Yesterday’s High, Low, and Close
- The day’s Opening figure
- Premarket Lows and Highs for the day
- 10 indicators to detect Divergence (All Divergence).
- Confirm the uptrend or downtrend of a ticker by the presence of a yellow candle
- Highlight Feature: Our ‘Long and Short signal‘ and ‘TOP & BOTTOM signal’.
The signals in SocLevel indicator are listed below.
1. 9 Key Levels
key levels in the indicator serve as significant support and resistance points of importance for intraday trading. Prices typically respect these points when reached.
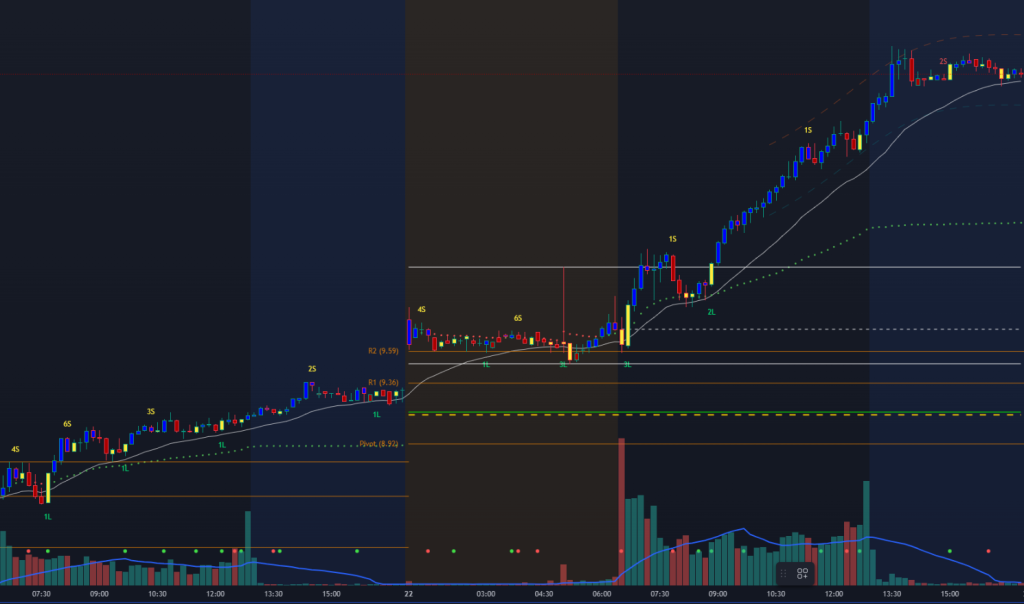
2. Bottom Signal
The Bottom signal represents a distinctive indicator signaling an imminent price escalation in the foreseeable future. Analogous to the Top signal, three distinct signals appear on the chart: Bottom 1, Bottom 2, and Final. These signals are seldom observed. Should they manifest within the daily stock frame, the probability of a significant price surge is notably elevated.
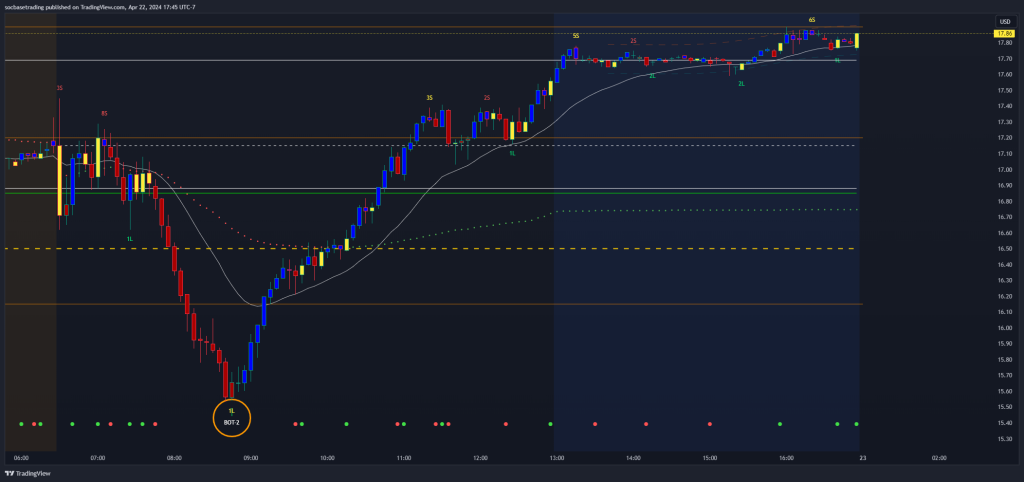
3. Top Signal
The Top signal is a unique indicator that forecasts an impending price decline in the near future. It includes three signals on the chart: Top 1, Top 2, and Final. These signals are quite rare. When they occur in the daily frame of any symbols, the likelihood of a substantial price decrease is significant. We have successfully employed these signals in our trading for many years.
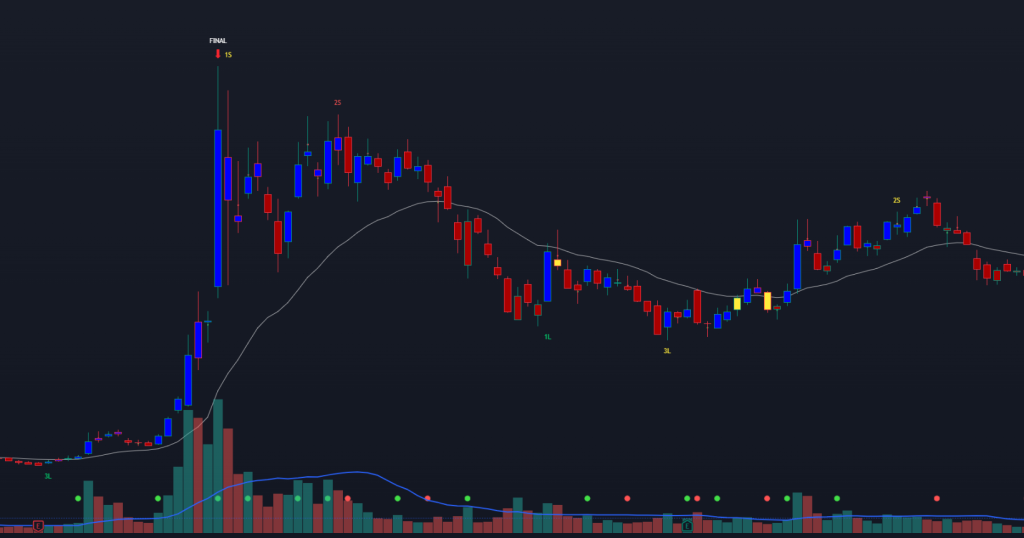
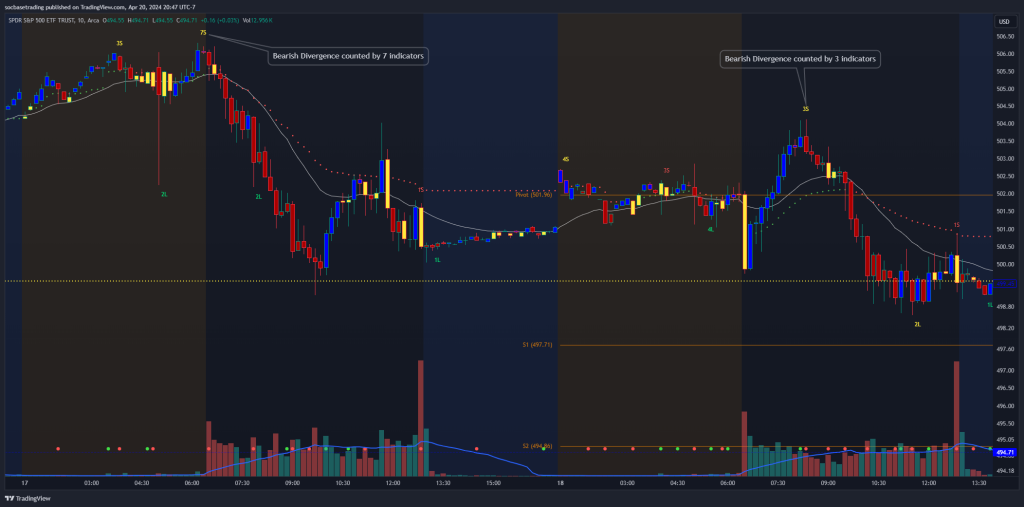
4. Short Signals (S)
The short signal indicates preparation for a Bearish Divergence system on the chart. The yellow ‘S‘ signifies Regular Bearish Divergence, while the red ‘S‘ represents Hidden Bearish Divergence. The number before ‘S’ is the count of indicators that scan for Divergence.
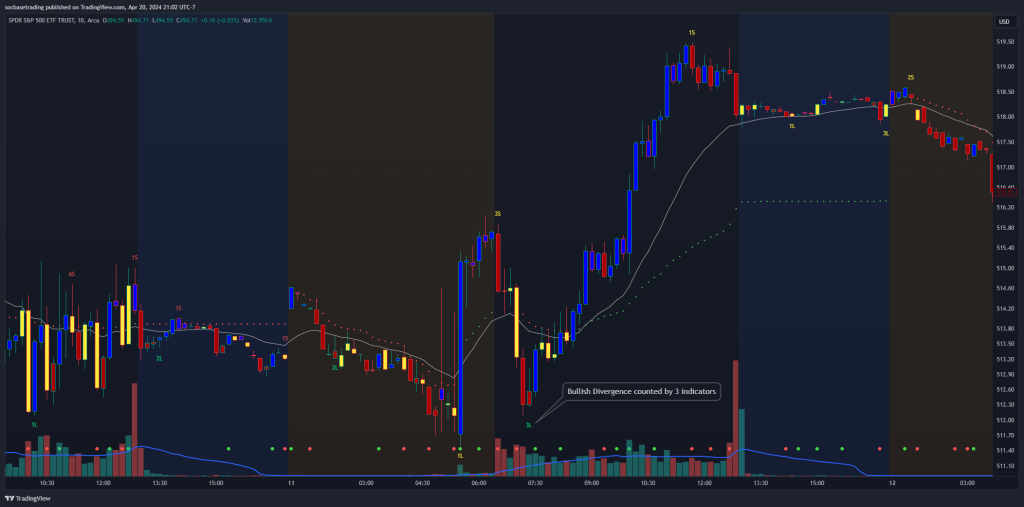
5. Long Signal (L)
The Long signal indicates preparation for a Bullish Divergence system on the chart. The yellow ‘L‘ signifies Regular Bullish Divergence, while the blue ‘L‘ represents Hidden Bullish Divergence. The number before ‘L‘ is the count of indicators that scan for divergence.
6. Confirm Trend
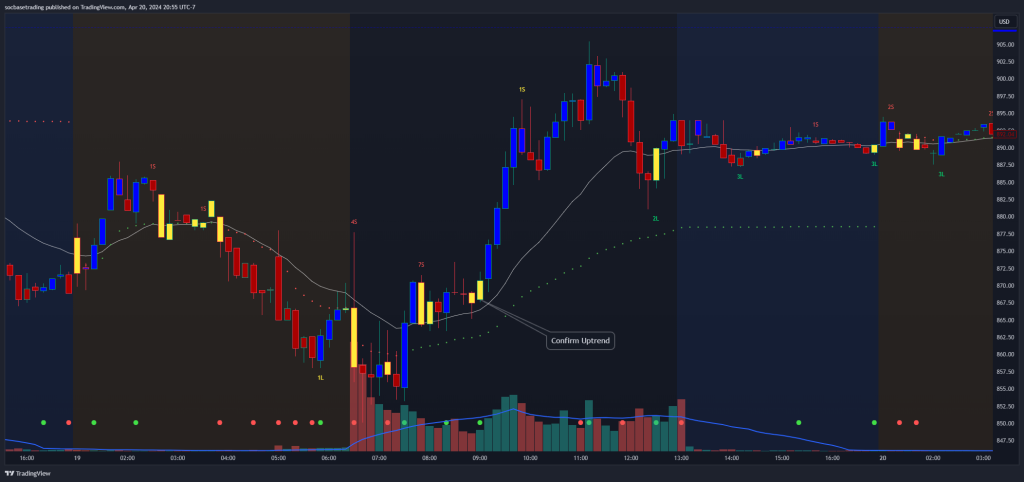
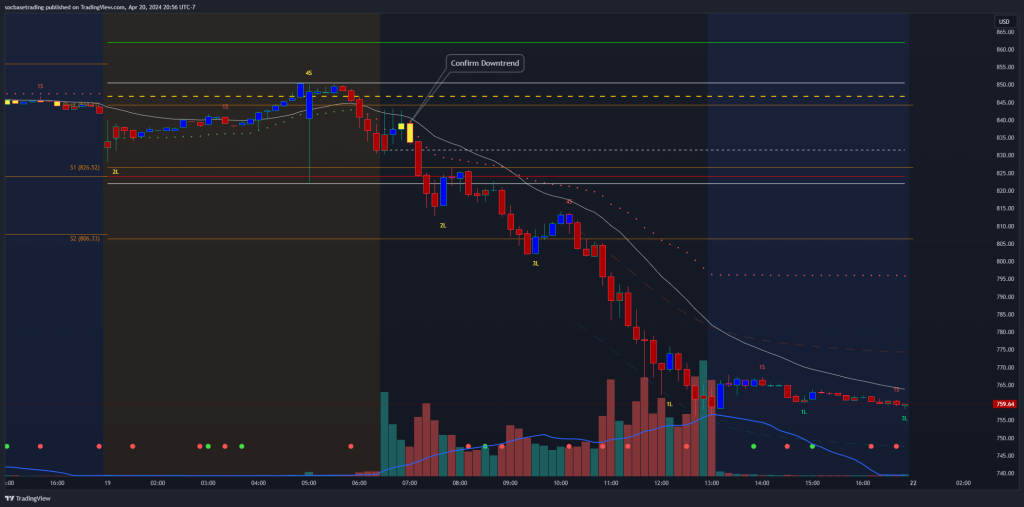
A yellow candle is one that signals a strong reversal or continuation of the trend on the chart. They are designed to assist traders in identifying secure entry points at positions where the market trend is likely to elicit a robust response. Traders need to carefully observe when a yellow candle appears.
6.1 The uptrend continues.
6.2 The downtrend continues
7. The cloud is used to measure overbought and oversold conditions.
If the price moves above the green cloud, it indicates that the price is overbought. Conversely, if the price moves below the orange cloud, it is considered oversold. When the price is in an overbought or oversold state, it’s advisable to avoid impulsive buying.

How to add an indicators:
After making a purchase on the website, go to your TradingView, click on ‘Indicators,’ then select ‘Invite Only Script.’ Add the ‘SocLevel’ and ‘Signal’ indicators, and then save the chart.
Join our Discord community to gain insights into utilizing SocLevel indicator effectively.

All good. Thanks for the post!
The blog is very professional and easy to read. That’s what I need. And many others.