What distinguishes ColorTrend as a powerful tool for supporting traders?
The ColorTrend indicator is an informational tool that assists all traders in safely entering orders. Algorithms are built according to A.I. from Price Action and Divergence algorithms to determine market trends more easily than any other indicator on the market. They work well in any time frame for all traders who need to trade various assets such as Futures, Options, Stocks, Forex, and Crypto with real signals.
By harnessing the power of ColorTrend, Traders unlock the potential to elevate their trading success. This tool not only bolsters the probability of securing profitable trades but also serves as a steadfast ally in mitigating the perils of trading-induced fear and the dreaded “Fear of Missing Out” (FOMO) syndrome.
Signals are displayed on the chart as
The signals in the ColorTrend indicator are listed below.
1. Top Signals

The Top signal is a unique indicator that forecasts an impending price decline in the near future. It includes three signals on the chart: Top 1, Top 2, and Final. These signals are quite rare. When they occur in the daily frame of any symbols, the likelihood of a substantial price decrease is significant. We have successfully employed these signals in our trading for many years.
2. Bottom Signals
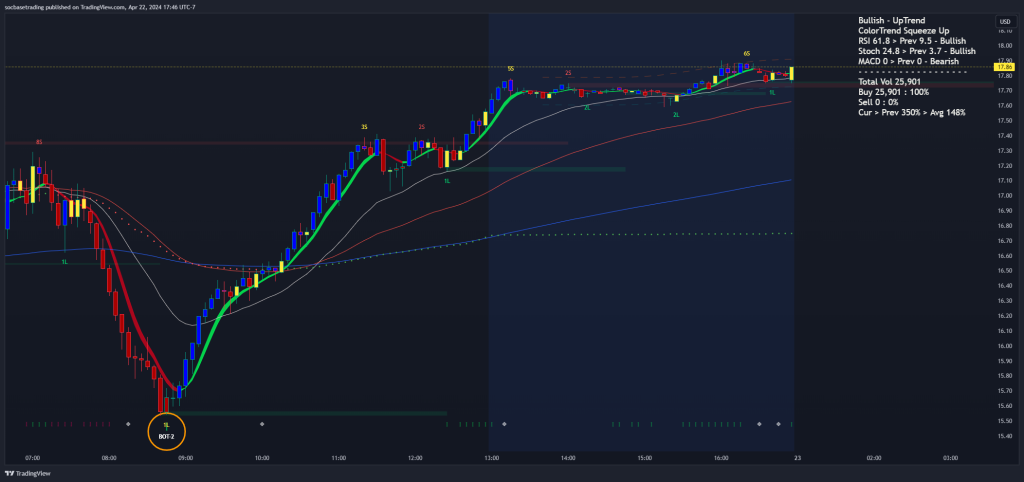
The Bottom signal is a unique indicator that indicates an impending price increase in the near future. Similar to the Top signal, there are three signals on the chart: Bottom 1, Bottom 2, and Final. These signals are infrequently observed. If they appear in the daily stock frame, the likelihood of a substantial price increase is very high.
3. Long Signals (L)
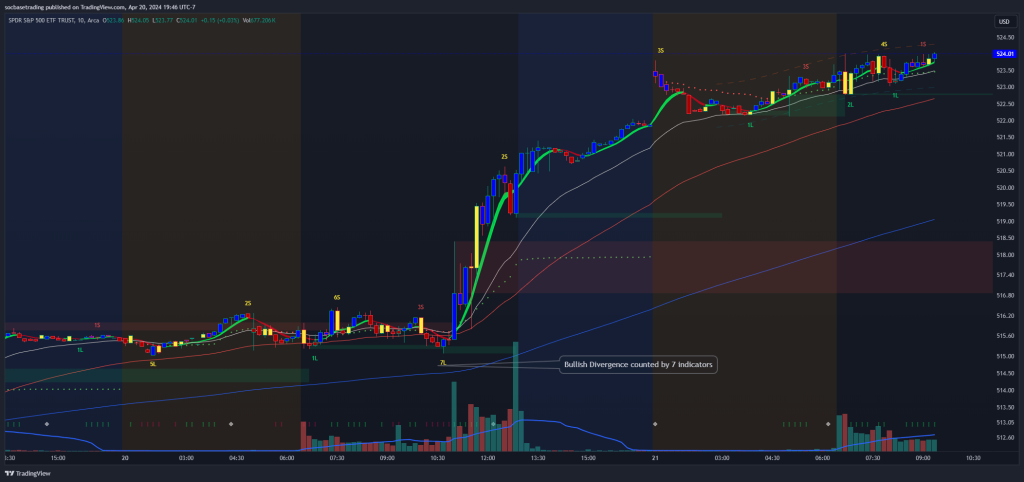
The Long signal indicates preparation for an upward trend. It is a Divergence System. The yellow ‘L‘ signifies Regular Bullish Divergence, while the blue ‘L‘ represents Hidden Bullish Divergence. The number before ‘L‘ is the count of indicators that scan for divergence.
4. Short Signals (S)
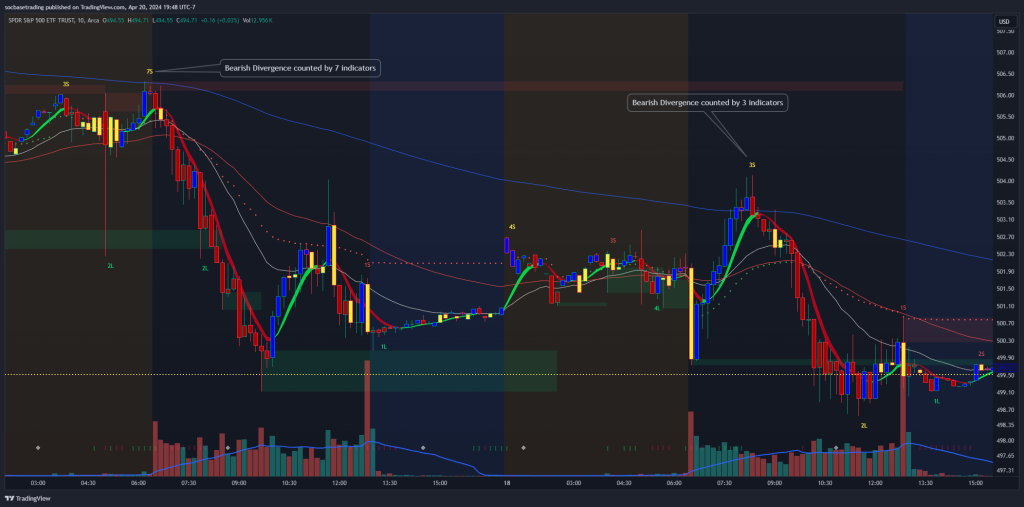
The Short signal indicates preparation for an downward trend. It is a Divergence System on Chart. The yellow ‘S‘ signifies Regular Bearish Divergence, while the red ‘S‘ represents Hidden Bearish Divergence. The number before ‘S’ is the count of indicators that scan for divergence.
Support and Resistance levels are displayed in real-time for each ticker across various time frames, aiding traders in making trading decisions by providing information about each ticker’s position. Large zones indicate strong trading areas.
5. Smart Squeeze Signals

Smart Squeeze is utilized to monitor the compression of a ticker before a significant price fluctuation. When looking below, traders can determine Squeeze Up, Squeeze Down, and finish Squeeze cycle. This signal works well in all time frames.
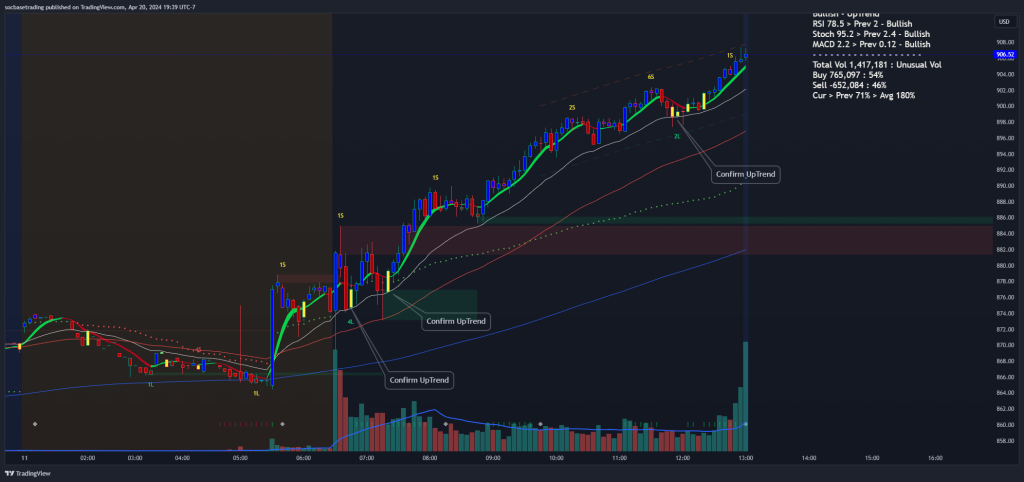
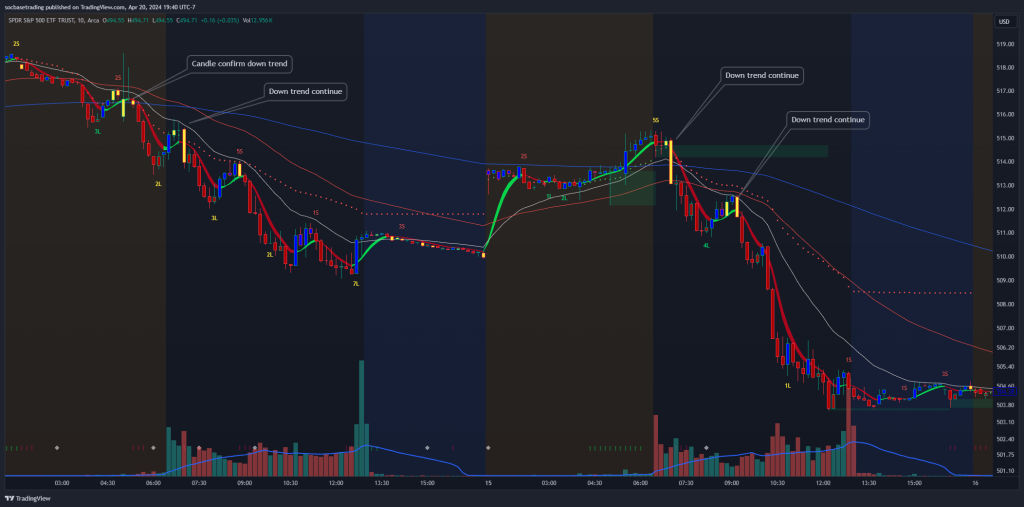
6. Yellow Candle confirms Trend
A yellow candle is one that signals a strong reversal or continuation of the trend on the chart. Traders need to carefully observe when a yellow candle appears.
6.1 – The uptrend continues.
6.2 – The downtrend continues.
7. Dashboard Information
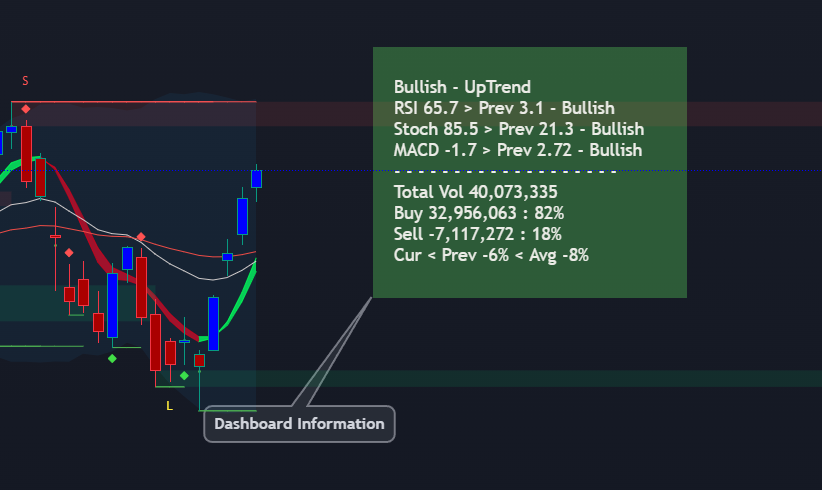
The dashboard will display all information, including trends, RSI status, Stochastic, MACD, total volume, and buy/sell percentages.
Within the context of the financial markets, ColorTrend, along with the aforementioned signals, proves to be an exceptionally powerful tool for traders. Proficiency in Technical Analysis is essential for effectively leveraging ColorTrend in your trading endeavors.
How to add an indicator:
After making a purchase on the website, go to your TradingView, click on ‘Indicators,’ then select ‘Invite Only Script.’ Add the ‘ColorTrend’ and ‘Signal’ indicators, and then save the chart.
Join our Discord community to gain insights into utilizing the ColorTrend indicator effectively.