Master Delta Volume – The Power of Tracking Order
What is Master Delta Volume ?
Master Delta Volume refers to the analysis of the orders that are being placed in the market, including buy and sell orders, as well as their volume, price, timing, trend, session volume profile and market internal. It provides traders with real-time insight into the supply and demand dynamics of a market, allowing them to see how other participants are placing their trades. This can help traders predict short-term price movements with greater precision.
Utilities of Master Delta Volume
Master Delta Volume analysis can offer several benefits to traders:
- Understanding Market Sentiment: By observing the flow of buy and sell orders, traders can gauge the market sentiment and identify whether the market is bullish, bearish, or neutral.
- Identifying Support and Resistance Levels: Master Delta Volume can help identify key support and resistance levels by showing where large orders are concentrated. These levels are where prices might experience reversals or breakouts.
- Timing Entries and Exits: Master Delta Volume allows traders to time their trades more precisely by showing when large players are entering or exiting the market.
- Detecting Delta Pressure: Displays the buying and selling pressure in both the present and past, enabling traders to assess market momentum effectively.
- Detecting Trend: Identify the trend of the selected ticker across any time frames of your choice.
- Detecting market trend: Gain insight into overall market conditions by analyzing internal market indicators like ADD and VOLD.
- Enhancing Trade Execution: By understanding the liquidity in the market, traders can execute trades with minimal slippage, improving their overall trading performance.
- Enhanced Trend Analysis: OBV offers a unique perspective by integrating volume data into trend analysis, making it an essential tool for trend confirmation.

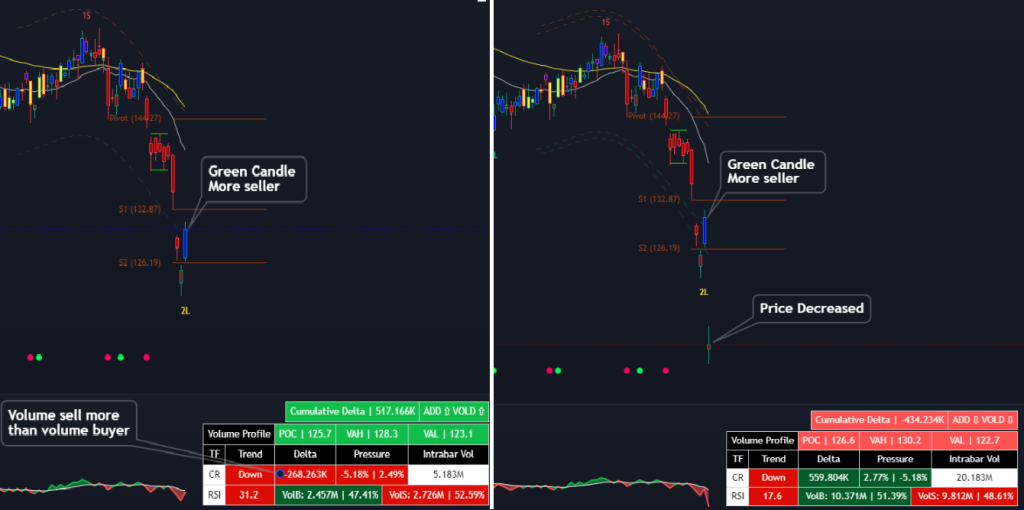
With each forming candle, traders will see the trading volume of both buyers and sellers using Master Delta Volume. A green candle may still contain significant selling pressure, potentially leading to a price decline—an occurrence known as a Bull trap when relying solely on traditional candles without monitoring Master Delta Volume.
How to Use Master Delta Volume:
- Identifying Aggression: Notice whether buyers or sellers are more aggressive. If most trades occur at the ask price, buyers are more aggressive, which may indicate upward momentum. Conversely, if trades occur mostly at the bid price, sellers are dominating.
- Delta: Delta Volume and pressure are displayed on the dashboard within each candle, allowing traders to see where the majority of buying or selling occurs. This helps in identifying potential reversals or continuation patterns.
- Cumulative Delta: It shows the cumulative difference between buying and selling volume over time. A rising cumulative delta suggests buying pressure, while a falling delta indicates selling pressure.
- Detect Trend: If the ticker is trending upward, the Dashboard will display ‘Up‘; conversely, it will show ‘Down‘ for a downward trend. The box will automatically change from green to red to match the trend.
- Volume Profile: Use Volume Profile, which shows the distribution of traded volume across different price levels, to identify areas of high interest. These can serve as strong support/resistance levels.
- Market Internal: Market internals are used to track the overall market, monitored through ADD and VOLD. If both are trending upward, the market is considered strong; if both are trending downward, the market is weak. When the two indicators are moving in opposite directions, the market is likely to be sideways.
- OBV Analysis: Early Warning Signals. By emphasizing the relationship between volume and price, OBV can signal potential market shifts early, offering you a competitive advantage. When OBV establishes higher highs, it indicates an uptrend, while lower lows signify a downtrend.
Strategies Using Master Delta Volume
- Trading: Master Delta Volume is particularly beneficial for scalping, day trading, and swing trading, depending on your trading style.
- Breakout Trading: Identify potential breakouts by watching for large buy or sell orders entering the market at key levels. If a large buy order pushes the price above resistance, it could signal a breakout.
- Reversal Trading: Master Delta Volume can help traders spot potential reversals by identifying exhaustion in buying or selling. For example, if a strong uptrend suddenly sees a surge in sell orders, it might indicate an impending reversal.
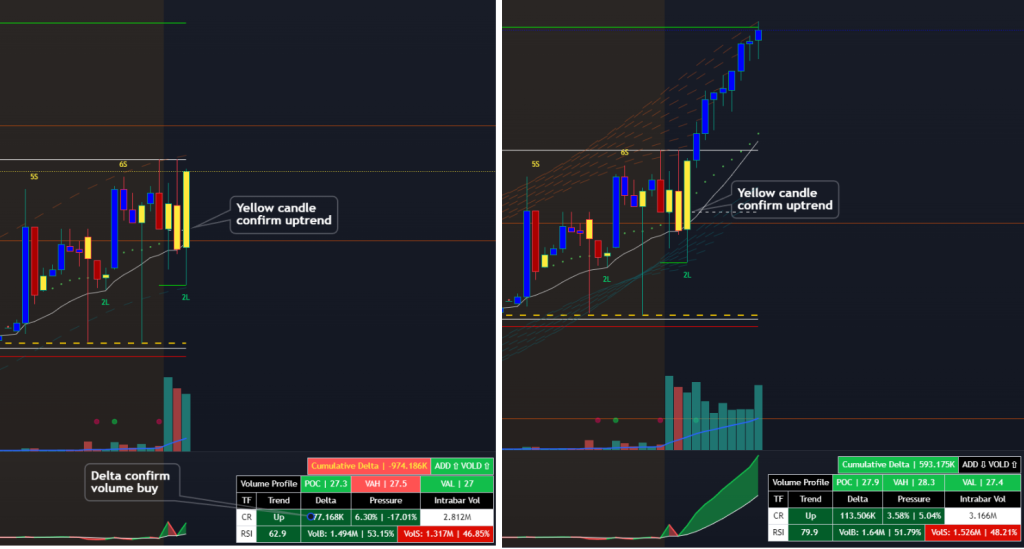
- Combine with SocLevel/SVP of Socbase: In SocLevel, signal and Session Volume Profile (SVP) indicators highlight potential entry points indicated by yellow candles and divergence. At the desired entry points, it is essential to seek confirmation from Master Delta Volume to ensure you are on the right track.
A continuation trend is confirmed by the yellow candle from SocLevel and Signal indicators. Additionally, Master Delta Volume confirms that buying volume is stronger than selling volume, resulting in the price being pushed up strongly, breaking through the POC, VAH, and consolidation zone of Session Volume Profile.

Delta is opposite to Candle:
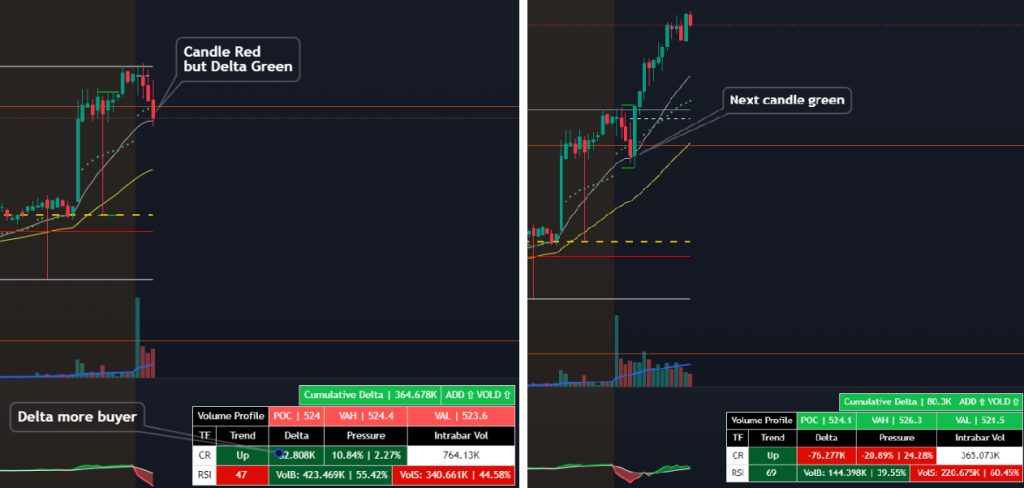
Delta is providing key insights into market momentum for traders. For instance, in an uptrend, a red candle accompanied by high buying volume (as indicated by Delta) suggests that the price is likely to continue increasing. Conversely, in a downtrend, a green candle with high selling volume signals (as indicated by Delta) that the price may keep decreasing. Please see the picture below.

Conclusion:
Master Delta Volume is a powerful tool that significantly enhances a trader’s ability to understand and predict market movements. By leveraging basic readings, advanced charts, cumulative delta analysis, trend market internals, and OBV, mastering order flow can provide a substantial advantage in trading. When you’re ready to place a Long or Short order, Master Delta Volume will show you whether Delta is dominated by buyers or sellers, helping to increase your transaction’s win rate.
Note:
1. To read order flow on TradingView, you need a premium package. Please check on TradingView’s rule.
2. Market internals are typically used for trading SPY, SPX, ES, NQ, and QQQ.
How to add an indicator:
After making a purchase on the website, go to your TradingView, click on ‘Indicators,’ then select ‘Invite Only Script.’ Add the ‘Master Delta Volume‘ then save the chart.
You are welcome to join our Discord community to gain valuable insights into their exceptional achievements and capabilities.
