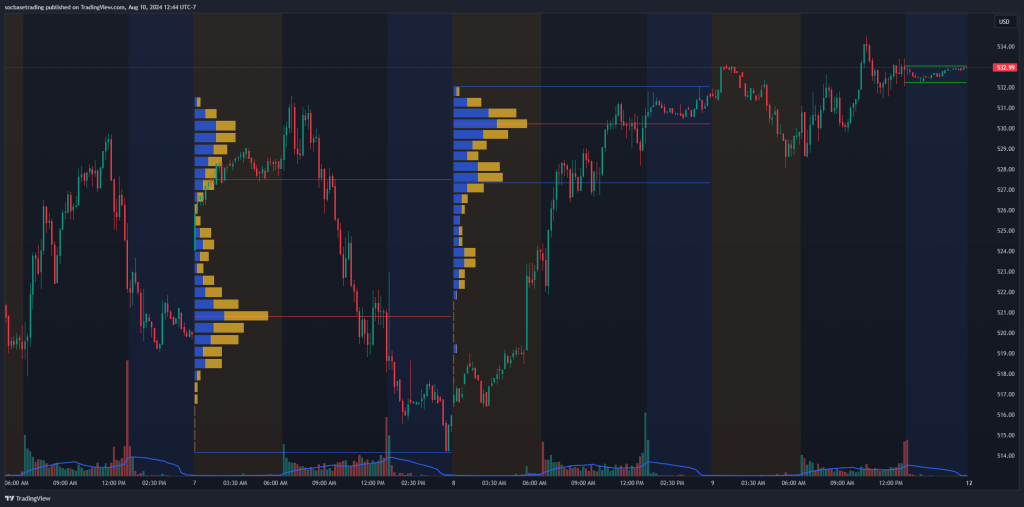
Session Volume Profile is a specialized tool that provides insights into trading activity during specific sessions, such as daily trading sessions. It helps traders understand how volume is distributed within a single trading day, revealing key price levels where significant trading activity occurs.
The Value Area Low (VAL) and Value Area High (VAH) define a broad range within which most of the trading activity occurs. Within this broad range, there exists a smaller range that is continuously monitored to identify consolidation zones, helping traders prepare for potential breakouts or breakdowns. This can be crucial for day traders and short-term traders who need to make quick, informed decisions.
When configuring the Session Volume Profile (SVP) for SOCBASE, the settings for SVP numbers and the period for monitoring the consolidation zone are optional and can be adjusted according to the trader’s preferences and strategy.
Basic Concepts
Volume Point of Control (VPOC):
The price level with the highest traded volume during the session.
Acts as a strong support or resistance level within the session.
It shows red line on Volume Profiles
Value Area (VA):
The price range where 70% of the session’s volume has been traded.
Includes Value Area High (VAH) and Value Area Low (VAL).
It shows blue line on Volume Profiles.
High Volume Nodes (HVNs):
Price levels with high trading activity within the session.
Indicate areas of consolidation and potential support/resistance.
Low Volume Nodes (LVNs):
Price levels with low trading activity.
Often signify potential breakout or reversal zones within the session.
Consolidation Zone:
The price is experiencing a small fluctuation.
Using Session Volume Profile: Basic Level
Step-by-Step Guide:
Adding Session Volume Profile to a Chart:
Add the indicator to your intraday chart, focusing on individual trading sessions.
Identify the VPOC:
Locate the price level with the highest volume within the session.
This level often acts as intraday support or resistance.
Observe the Value Area:
Identify the VAH and VAL for the session.
Trading within this range suggests the market is balanced during the session.
Recognize HVNs and LVNs:
HVNs can act as intraday support/resistance levels.
LVNs can be potential areas for breakouts or reversals within the session.
Breakout/breakdown consolidation zone
Tracking for breakout/breakdown status before testing VAL, VAH, and POC.
Example:
On a 5-minute chart of stock ABC, you add the Session Volume Profile for today’s session. The VPOC is at $50, the Value Area ranges from $48 to $52, HVNs are at $49 and $51, and LVNs are at $47 and $53.
Trading Strategy:
Support/Resistance: Place buy orders around $48-$49 (support) and sell orders around $51-$52 (resistance).
Breakouts: Watch for breakouts above $52 or breakdowns below $48 for potential trades.
Using Session Volume Profile: Advanced Level
Multiple Sessions:
Compare Session Volume Profiles across multiple trading days to identify consistent key levels.
Look for repeating patterns in VPOC, VA, HVNs, LVNs and Consolidation Zone.
Monitoring Changes:
Observe how the Session Volume Profile evolves throughout the day.
Shifts in VPOC or Value Area during the session can indicate changing market sentiment.
Custom Time Periods:
Create custom Session Volume Profiles for specific intraday events (news releases, market open/close) to see how volume is distributed during those times.
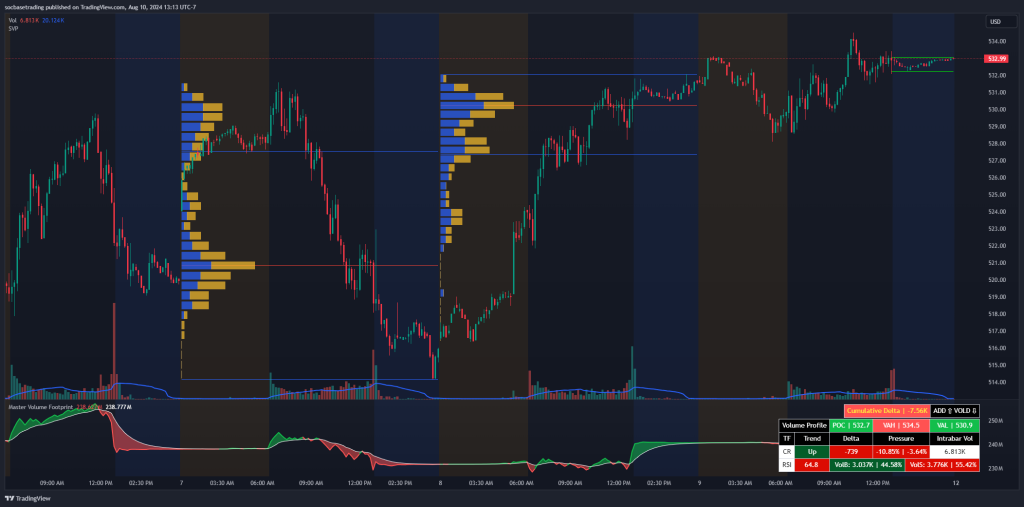
Master Delta Volume:
Combine Session Volume Profile with Master Delta Volume to get a detailed view of intraday market behavior. Traders will see order buy and sell and know who is control at that area.
Master Delta Volume focuses on order Flow, Delta of Buyer/Seller, Pressure of Delta, Trend on multi timeframe, providing insights into intraday market structure.
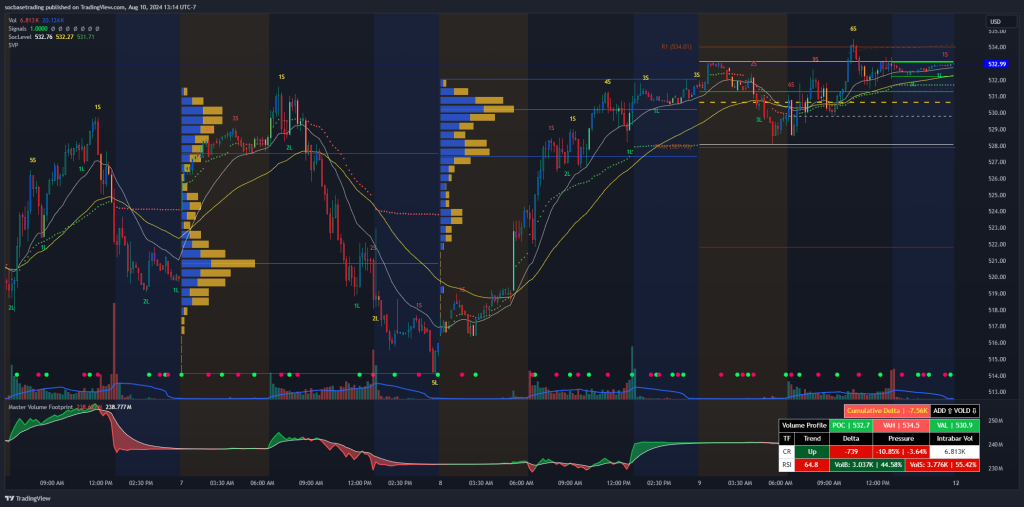
Key Levels + Signals
A session VPOC aligning with SocLevel can be a strong support/resistance level throughout the 9 key levels and a moving average of SocLevel.
Use VWAP in conjunction with Session Volume Profile for intraday trading.
VWAP acts as a dynamic support/resistance level, often used by institutional traders.
Add confirmation of multiple Divergences in indicator signals.
Advantages of Session Volume Profile
Intraday Insights:
Provides detailed volume distribution within a single trading session.
Helps identify key intraday support and resistance levels.
Market Sentiment:
Offers a clear view of where traders are most active during the session.
Assists in understanding intraday market behavior and sentiment.
Scalability:
Useful for different trading styles, from scalping to day trading.
Can be customized for specific intraday events or periods.
Disadvantages of Session Volume Profile
Complexity:
Requires a good understanding of intraday market dynamics.
Can be overwhelming for beginners.
Data Intensive:
Relies on high-quality intraday volume data.
Poor data quality can lead to inaccurate profiles.
Lagging Indicator:
Based on historical intraday data.
May not always predict future price movements within the session.
Conclusion
The Session Volume Profile is a versatile tool that provides valuable insights into intraday trading activity. By understanding how volume is distributed within a session, traders can identify key support and resistance levels, recognize potential breakout zones, and make informed trading decisions. Whether used on its own or in combination with Master Delta Volume, SocLevel, and Signals, mastering the Session Volume Profile can significantly enhance a trader’s ability to navigate the markets. However, like any tool, it has its limitations and should be used alongside other analysis methods for the best results.
How to add an indicator: After making a purchase on the website, go to your TradingView, click on ‘Indicators,’ then select ‘Invite Only Script.’ Add the ‘Session Volume Profile‘ then save the chart.
Join our Discord community to gain insights into utilizing Session Volume Profile indicator effectively.